Recessed Connector Panel
The connector panel, shown above, is thoughtfully recessed into the body of the camera for protection and provides access for all external connections. The two threaded holes on the back of the body are used to attach an optional cable restraint system to support the electrical connections as well as the recirculation hoses for the liquid heat exchanger.
Optional Liquid Cooling
All 500 Series cameras allow the attachment of a liquid heat exchanger to increase cooling in warmer environments. Allowing the removal of the heat exchanger when assisted cooling is not necessary keeps the depth and weight of the camera to a minimum.
Slim Internal Color Filter Wheel
The 500 Series internal color filter wheel accepts up to 5 interchangeable 1.25″ filters. Shown above is the standard LRGB color filter set in a 516ws camera. The filter wheel only adds 1/2″ to the camera depth and backfocus.
Tight Spaces Aren’t a Problem
Pictured above is a fully configured 532ws camera with add-on liquid heat exchanger. Even when attached with a ‘generously’ long 2″ eyepiece adapter, it still passes cleanly through the forks of a popular Schmidt Cassegrain telescope
Forced Air Cooling
The heatsink cooling fins are an integral part of the camera body and the configurable, intelligent cooling fans are recessed into the surface. This keeps the entire cooling system within the smooth envelope of the camera and eliminates protruding structures that can tangle cables or catch on the camera’s surroundings.
Body Configurations
A defining feature of the 500 Series is the flexible design that permits three progressively configured body styles with a minimal impact on overall size. The three body configurations, Slim, Medium, and Full, are compared in the image above. The Slim body is the thinnest version and can be used with CCDs incorporating an electronic shutter. The Medium body provides addition space for an internal mechanical shutter. The Full body allows the installation of both the shutter and the five position filter wheel.
When Size Matters
The compact size and short backfocus can be a real asset when your optical train gets long and complicated. The light weight, slim design significantly reduces the camera moment-arm resulting in less strain on the intervening components and greater overall stability.
Extended Life CCD Environmental Chamber
Located under the camera name plate is a user-rechargeable microsieve desiccant employed to scavenge any water molecules that enter the hermetically sealed CCD chamber. It is isolated from the CCD by a sub-micron, permeable membrane. The desiccant can greatly extend the interval between chamber re-purging and, depending on your requirements, eliminate it all together.
Attachment Flexibility
The versatile design of the 500 Series cameras allows a range of attachment options. Interchangeable T and C mount adapters are available for all cameras. Pictured above is an adapter for a standard 35mm camera lens. Other custom adapters and configurations are easily accommodated by direct attachment to the front of the camera body.
Internal Mechanical Shutter
The 500 Series long-life internal shutter subsystem is designed for flexibility. The thin shutter actually carries the control electronics for the shutter and filter wheel embedded in its mounting plate, minimizing the thickness of the entire assembly. Adding a filter wheel only adds 1/2″ to the overall camera depth.
Microscopy
Due to their exceptional imaging performance, compact size and light weight, the QSI 500 Series cameras are well suited for microscopy and biological sciences applications. Illustrated above is a 520ci mounted atop a stereo microscope via the available C-Mount adapter.
CAD-CAM and CNC Manufacturing
Engineered with extensive use of sophisticated CAD-CAM design tools, the 500 Series is CNC machined from aircraft grade aluminum alloy. The image above is a close-up of a production run of camera bodies ready for final quality control inspection before anodizing.
Integrated Guider Port
The QSI 500 Series “wsg” models solve the problems with other guiding solutions by integrating a Guider Port directly into the camera body with the pick-off prism positioned in front of the integrated color filter wheel – right where it belongs.
600 Series 8-position Color Filter Wheel
QSI 600 Series cameras area available with an internal 5 or 8-position Color Filter Wheel. The 8-position CFW is shown above on a QSI 683. WS and WSG covers are available with the larger filter wheel. The size of the cameras is still remarkably small even with the 8-position filter wheel, which adds less than 1.5″ to the height and width. Back focus is idential to the standard 5-position CFW models ensuring that only one set of adapters are needed when switching between 5 and 8-position models.
 How sensitive a CCD it to light is expressed as its Quantum Efficiency (QE). Higher QE means you can collect more photons in any given amount of time giving you better looking images with a higher Signal to Noise Ratio (SNR). High sensitivity is almost purely a function of the CCD. Just about any camera using the same CCD will achieve a similar sensitivity to light.
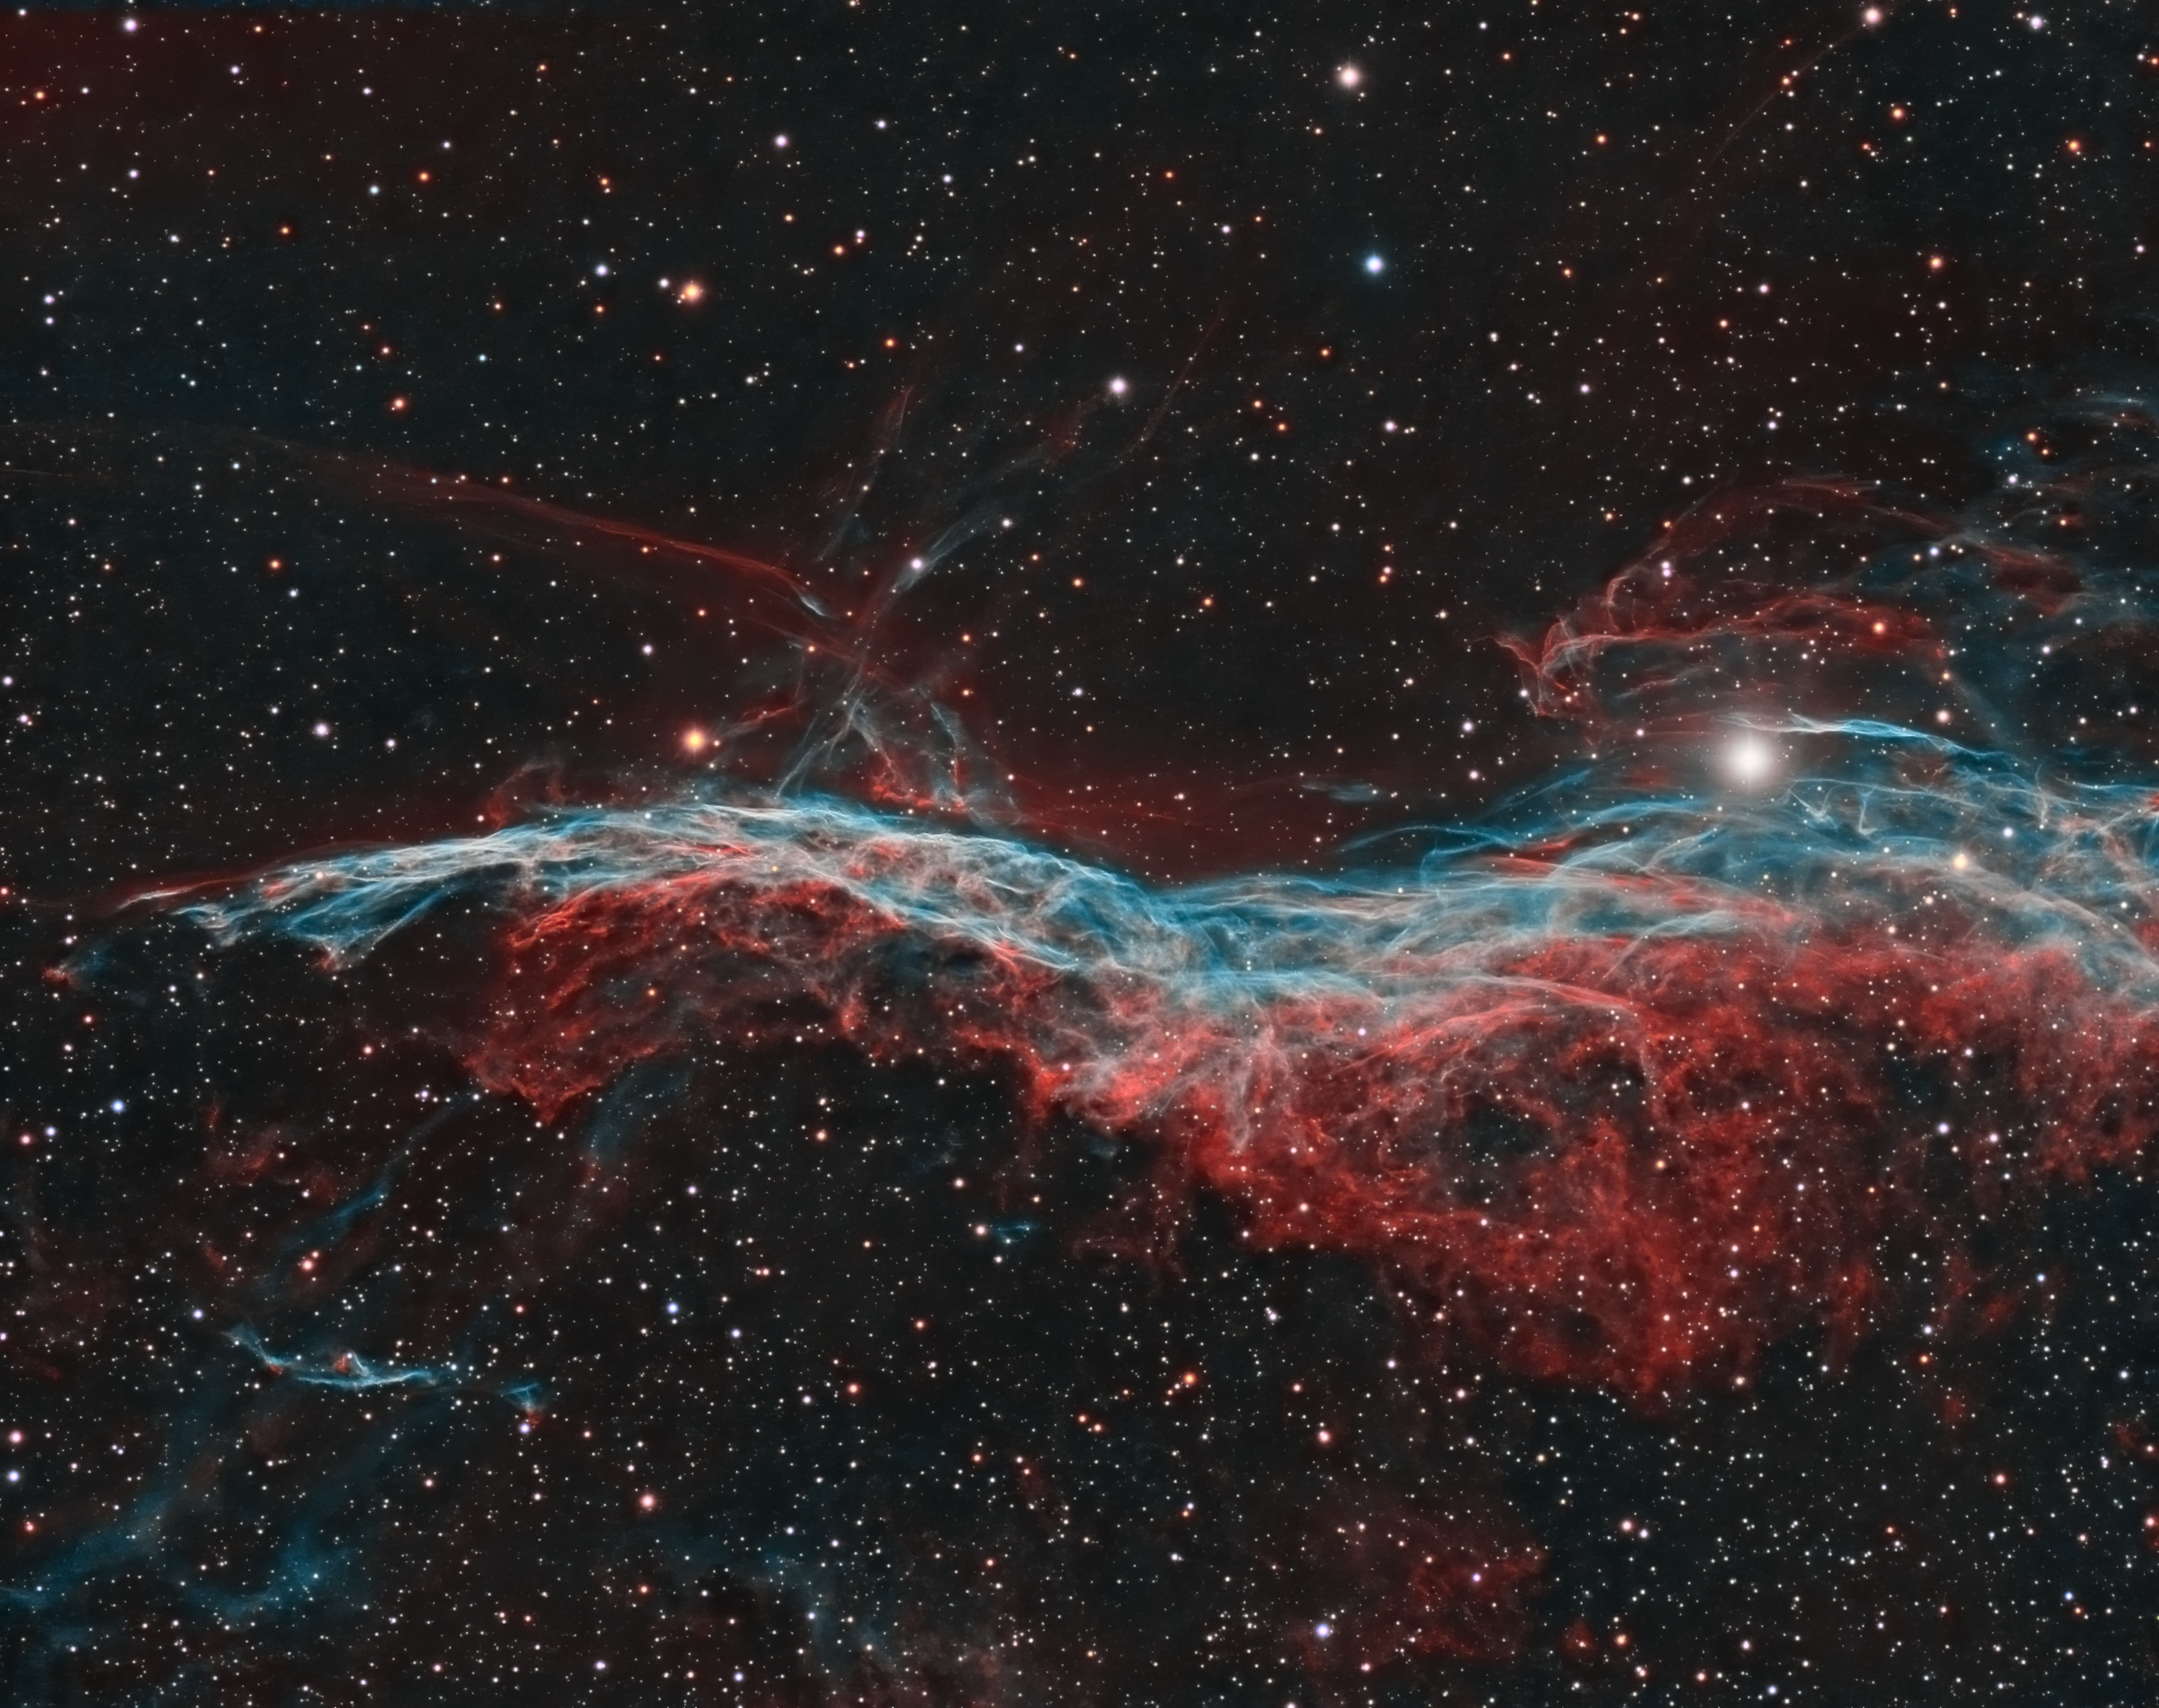
However, even with the same CCD, the Signal to Noise Ratio between two different cameras can be dramatically different especially in the fainter, lower signal areas of an image. These lower signal areas, such as the fringes of nebulae or dust lanes in a galaxy, often comprise some of the most interesting parts of astronomical images. Maximizing the SNR in these dim areas is the key to revealing those otherwise hidden details.
Lower Noise = Higher Dynamic Range
Noise in a CCD camera is uncertainty in the signal you’re trying to measure. The lower the noise, the greater the dynamic range possible with any given CCD. There are several types of noise that contribute to the overall noise in a CCD image. See “Understanding CCD Noise” for a more complete discussion of the sources of noise in CCD images.
CCD images are exquisitely sensitive to any noise introduced by the camera’s electronics. Mitigating the electronic interference from the digital electronics and switching power supplies is one of the many challenges in designing and building a scientific grade CCD camera. Any noise introduced by the camera is relatively easy to see by analyzing bias frames. A Bias Frame is a zero-length (dark) exposure which captures the slightly varying “floor value” from pixel to pixel (the bias) plus any noise added during the process of reading the image from the CCD. By subtracting two bias frames, you can remove the underlying differences in the pixel bias leaving just the noise added to the image when it was read from the CCD. This subtraction of two bias frames is called a Read Noise Frame. See “Measuring CCD Read Noise” for more information about Read Noise frames and how to produce them with your own camera.
Complicating the story is that some types of noise are tougher to deal with than others. For instance, truly random noise that displays a Gaussian distribution can be reduced by combining images. The graph to the right shows the histogram of a bias frame from a QSI camera overlaid over histograms from two other cameras using the same Kodak CCD. The histograms have been normalized for easy visual comparison. The histogram from the QSI camera displays a nearly perfect Gaussian distribution. The familiar bell curve resembles a parabola when displayed with a log scale. Standard deviation (σ) is shown for each histogram.
The parabolic shape of the histogram is important but you can’t infer too much about the magnitude of the noise from the width of a histogram without knowing more about the cameras. Differences in width can be caused by higher noise or possibly just differences in a camera’s gain settings.
Averaging together multiple bias frames can tell you more about the distribution of pixel values and make it easier to visually identify any non-Gaussian noise in the images.
 To the left is a histogram comparing the average of 10 bias frames from a QSI 520i to a camera from another manufacturer with the same sensor taken at the same -10C temperature. The graph has the same scale as the one above for the single bias frames.
Note that both histograms are now narrower than the histograms for the single frames. This is a result of the noise being reduced in the combined frames because the random (Gaussian) noise tends to cancel out getting you closer to the “true” value of the underlying data. Also note however that the red histogram trails off to the right no longer resembling a parabola like the blue histogram from the QSI camera. This non-Gaussian noise typically has components of both pattern noise and stray pixels that fall outside the target Gaussian distribution. Pattern noise in particular will not be reducedby combinging frames. Instead this type of noise combines just like signal reinforcing itself and reducing the signal to noise ratio in your final images.
Bias frame histograms, however, can’t tell you the full story. The width and shape of the histogram shows the magnitude and overall distribution of the noise, but it tells you little about the structure of that noise. To do that requires another tool, the Fourier Transform.
A Fourier Transform is a mathematical function that converts a signal (any signal) into a collection of sine waves which together exactly represent the original signal. For images, we’re interested in 2-dimensional Fourier Transforms which convert an image from the Spatial Domain, rows and columns in a digital picture, into an equivalent Frequency Domain image. A Fast Fourier Transform (FFT) is a special algorithm that runs much faster on computers when starting with square images where each side has a length equal to a power of 2 (e.g 256, 512, 1024).
 To analyze the noise from a CCD camera, you create a Read Noise Frame as described above. By subtracting two bias frames, you end up with just the noise introduced by reading the image from the CCD. An FFT of that Read Noise Frame will reveal any pattern noise introduced by the camera. See “Interpret Read Noise Frame FFTs” for additional details on making and interpreting Read Noise FFTs with your camera.
An FFT of random noise displaying a Gaussian distribution will have a smooth dark background with a single bright pixel in the center. To the left is an FFT of a Read Noise Frame from a QSI 500 Series camera. The FFT of the QSI Read noise frame reveals no pattern noise and is, in fact, virtually indistinguishable from an FFT of mathematically generated Gaussian noise.
To the left is the FFT of a Read Noise Frame from a camera that introduces non-Gaussian, periodic noise into the image. Note the series of vertical lines running through the FFT and the three bright dots near the
center. Those vertical lines in the FFT are the result of horizontal noise of various frequencies in the original image.
Periodic noise will not be reduced when combining multiple images; instead it is reinforced, just like signal.The net effect of such noise is to raise the noise floor, reducing the signal to noise ratio and hiding the faint details in your images. When many such images are combined, periodic noise may show up as visible patterns, such as faint horizontal or vertical lines, running through your images.
Roll your mouse over the image to the right to see an example from a camera that displays even stronger pattern noise.
The images below of a standard optical target demonstrate one of the benefits of low noise and a Gaussian distribution. The images were captured with a QSI 516 camera in a very dark room. A single image closely resembles a bias frame. The target is virtually indistinguishable from the background. Its Signal to Noise Ratio is nearly zero. With an average combine of 50 frames, light and dark areas are clearly visible. With 200 frames, the target pattern is easily identifiable. Note that even after combining 200 frames, the difference between the dark and bright pixels is only 0.45 ADUs on average.
Lower noise displaying a Gaussian distribution allows you to reveal
subtle details in your targets that would otherwise be lost
Single image Average of 50 images Average of 200 images

Accurately recording the relative amount of light between different objects requires a camera that delivers a linear response to varying levels of light. A CCD camera should record twice the photon flux from an object that is twice as bright. Cameras that use CCDs with anti-blooming protection will start to show a drop in linearity as the pixels begin to approach a high percentage of full well capacity, but should be nearly linear at lower signal levels.
The log scale graph above shows the response to light of a QSI 520i which uses an interline transfer CCD with anti-blooming protection. the log scale of the graph amplifies any discrepencies from linear response especially at the lowest signal levels. The data points are linear to less then 1% all the way down to the lowest signal level, well within the specification of the CCD. Lower noise is especially critical in maintaining linearity at these lower signal levels.
High linearity is obviously critical for scientific applications such as accurate photometry, but it’s just as important for producing beautiful pictures of deep sky objects. A linear response to light and lower noise allows you to accurately capture the subtle details of your targets in less time. To achieve the same signal to noise ratio in the faintest areas of your images with a higher noise camera can require hours more exposure time. Turning that around, a lower noise camera will yield great looking images with a higher signal to noise ratio in much less time.
Every image taken with a CCD camera has two distinct types of “signal”. A CCD records light striking it from the objects in your field of view, and it records heat from the sensor itself. Cooling the CCD reduces the contribution of this “thermal” current. With most Kodak CCDs, the amount of thermal current is cut in half for every roughly 6°C drop in the temperature of the CCD. So, dropping the temperature of the CCD by 36°C reduces the rate that thermal current builds by over 98%.
The rate that thermal current builds at any given temperature is very predictable and repeatable. That’s why dark frame subtraction is so effective. Subtracting an average or median combine of multiple dark frames taken at the same temperature as your light frames will remove the thermal current component (and bias) from your light frames. However, if the temperature varies either during the capturing of your light frames or dark frames by even a few tenths of a degree, dark frame subtraction becomes much less effective.
The graph above plots the temperature of the CCD in a QSI 500 Series camera cooling from an ambient temperature of 13.5°C (56°F) down to -20°C. The drop of a little over 33°C below the ambient temperature took just over six minutes. QSI 500 Series cameras will generally cool the CCD to approximately 38°C below the ambient temperature and then regulate the temperature to within 0.1°C.This fine control of the temperature allows for very precise and very repeatable dark frame subtraction. 600 Series cameras have increased cooling capacity to approximately 45°C below the ambient temperature.